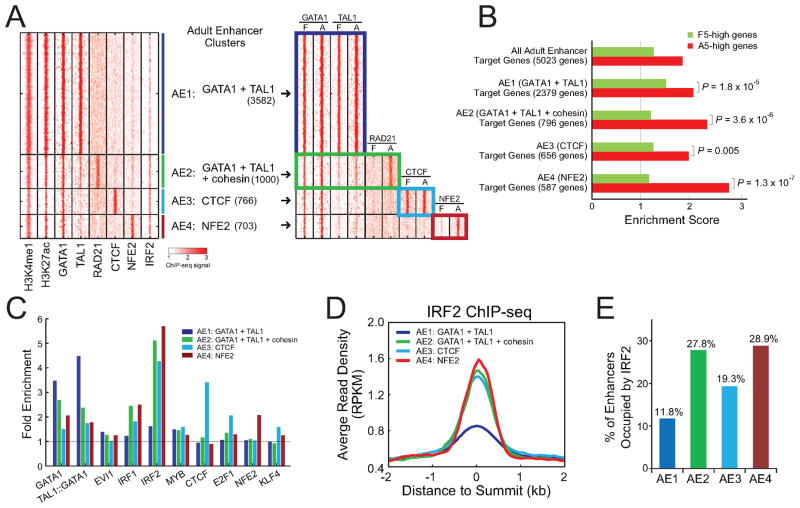
Figure 6. Combinatorial Regulation of Enhancer Functions.
(A) K-means clustering of all TF-associated adult enhancers (see Experimental Procedures). The heatmap on the left shows ChIP-seq read density of all TFs used for clustering in adult ProEs. The heatmap on the right shows a side-by-side comparison of ChIP-seq read densities between fetal and adult ProEs within the same enhancer clusters (AE1 to AE4).
(B) Target genes of all adult enhancers and each enhancer cluster were compared with genes differentially expressed between F5 and A5 ProEs. The enrichment scores and P-values were calculated as in Figure 5A.
(C) Enrichment of selected JASPAR motifs in each enhancer cluster. The fold enrichment represents the frequency to observe motif targets in the selected enhancer cluster compared to randomly selected regions from human genome.
(D) ChIP-seq density plot is shown for IRF2 within each enhancer cluster in adult ProEs.
(E) Fraction of IRF2-occupied enhancers within each enhancer cluster is shown.

