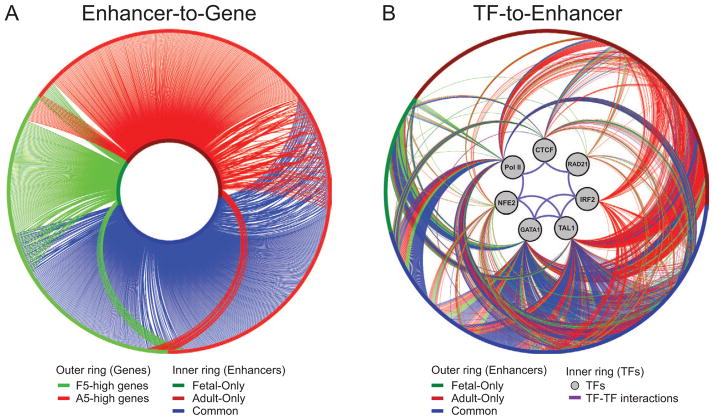
Figure 8. Gene Regulatory Networks underlying Human Erythropoiesis.
(A) Enhancer-to-Gene network. The edges represent the mapping of enhancers to their target genes. The inner ring of the network represents enhancers, colored according to whether they were identified in fetal (green), adult (red), or both (blue) samples. The outer ring represents differentially expressed genes that are upregulated in fetal (green) or adult (red) ProEs. Edges between enhancers and genes are colored according to their originating enhancers.
(B) TF-to-Enhancer network. The outer ring represents the same set of enhancers as shown in the inner ring of panel (A). The inner ring contains the seven profiled TFs. Edges extending from these TFs to an enhancer represent the presence of an identified TF binding site in this enhancer region in fetal (green), adult (red), or both (blue) samples. Known protein-protein interactions (purple edges) between the profiled TFs are also indicated.
See also Table S8.

