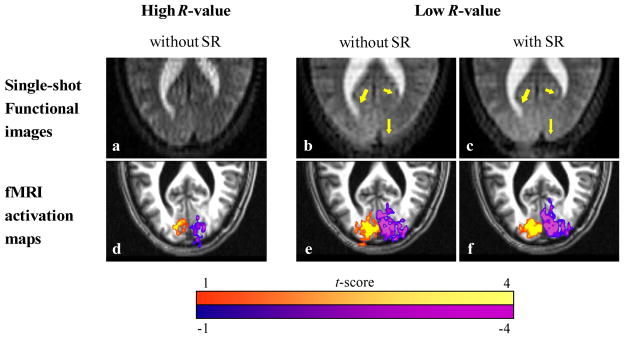
Figure 3.
Assessment of the SR reconstruction procedure applied to, Top: single T2-weighted functional images, and Bottom: fMRI time series of alternating left & right visual stimuli, corresponding respectively to positive (yellow) and to negative (purple) t-values. Maps are shown for one representative subject out of the three tested, and are displayed (lower row) overlaid on a corresponding T1-weighted high-resolution FLASH image [ROI = 192×96 mm]. All data were collected using the Hybrid SPEN sequence shown in Figure 1c. Left column (a,d): data acquired using high R-values having an optimal a priori resolution (i.e., one voxel per sampled point along the SPEN axis). Middle column (b,e): data acquired using low R-values and reconstructed with magnitude-only algorithm. In this case, spatial resolution is reduced due to the broader PSF and blurring is observed in both the T2- weighted image and the activation map. Right column (c,f): images acquired using low R-values and super-resolved in post-processing. Yellow arrows mark regions highlighting the resolution enhancement afforded by the SR procedure.

