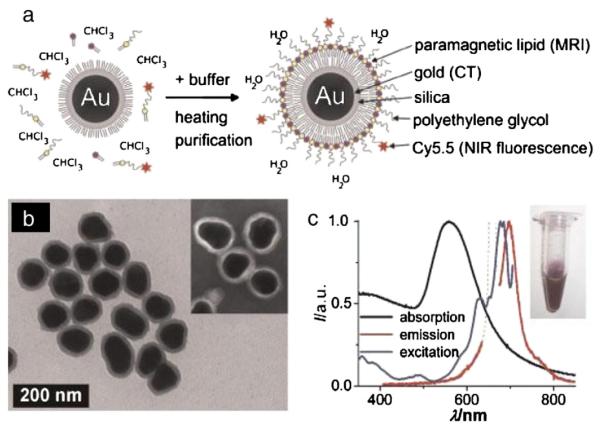
Fig. 4.
(a) Schematic representation of the nanoparticle lipid-coating procedure. (b) TEM image of hydrophobic gold/silica particles (88±9 nm). The inset shows a negative stain TEM image of the lipid-coated particles. (c) Absorption (black), emission (lexc 660 nm; red), and excitation (lem 710 nm; blue) spectra of the aqueous lipid-coated gold/silica particle dispersion (inset). Note that the dotted line in the emission spectrum is due to scattered excitation light, and thus, not attributable to Cy5.5 emission. Reproduced, with permission, from Ref. [255]. (For interpretation of the references to color in this figure legend, the reader is referred to the web version of this article.)

