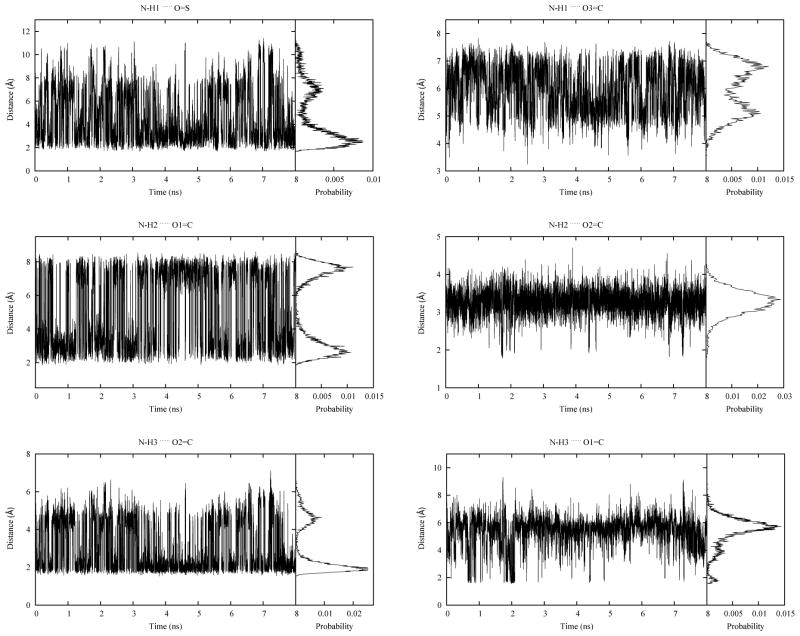
Figure 7.
Samplings of the distances between hydrogen bonding donor oxygen atoms and acceptor hydrogen atoms during the simulation. Probability distributions are also shown on the right side of each plot. For the N-H1…O=S interaction pair, as there are two oxygen atoms in sulfonyl group, the shorter distance at each time step was used.

