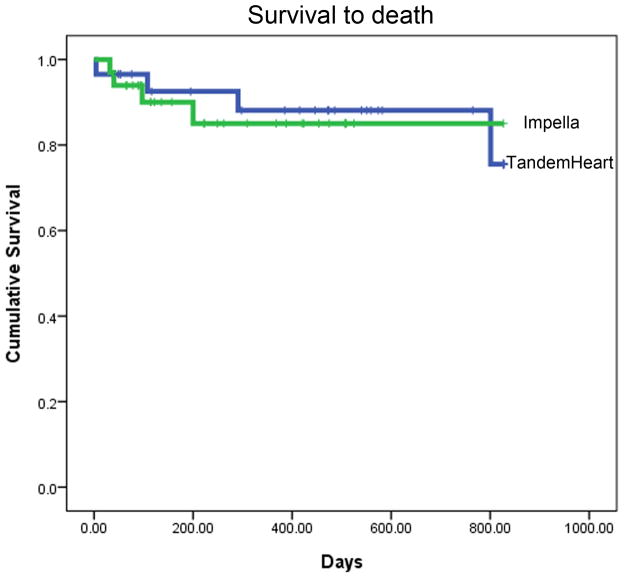
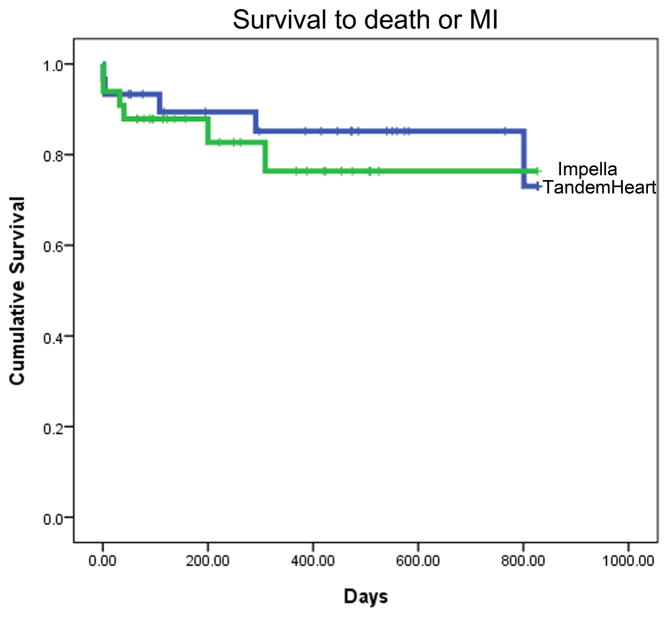
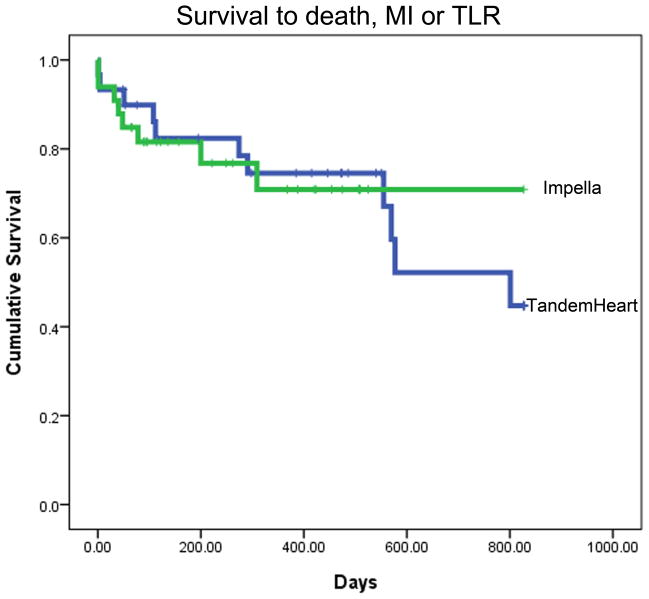
Fig. 1. Survival to (A) death, (B) death or MI, and (C) death, MI or TLR.
Kaplan Meier analyses showing mean event free survival times as indicated. Data includes peri-procedural events. Data for TH is shown in blue and for IR2.5 in green. There were no statistically significant differences between the TH and IR2.5 groups for these outcomes.


