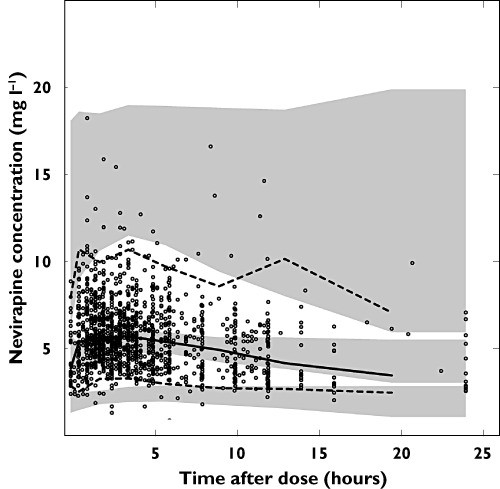
Figure 3.

Prediction and variability corrected VPC of final model applied to the external validation data set showing observations (open circles), the fifth (dashed line), 50th (continuous line) and 95th percentile (dashed line) of the observations and the simmulated confidence intervals for the the fifth, 50th and 95th procentiles (shaded areas). Fat-free mass was imputed with the model developed on P3M data
