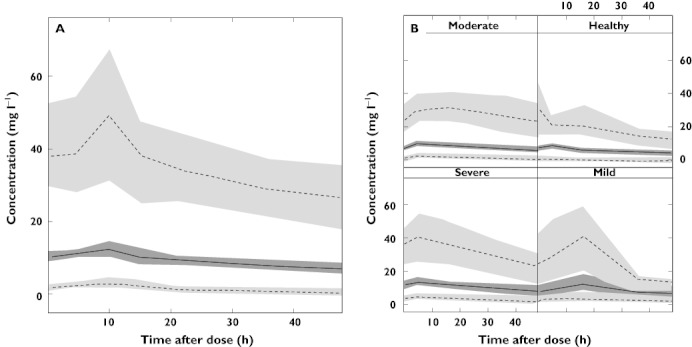
Figure 2.

Visual predictive check showing the 95% percentiles (dashed line) and 50th percentile (solid line) and their respective confidence intervals for the model predicted data of the total cohort for (A) 48 h after allopurinol dosing in the total cohort and (B) 48 h after allopurinol dosing in patients with varying degrees of renal impairment. Healthy, CLCr >60 ml min−1; mild, CLCr 30–60 ml min−1; moderate, CLCr 15–30 ml min−1; severe, CLCr 0–15 ml min−1
