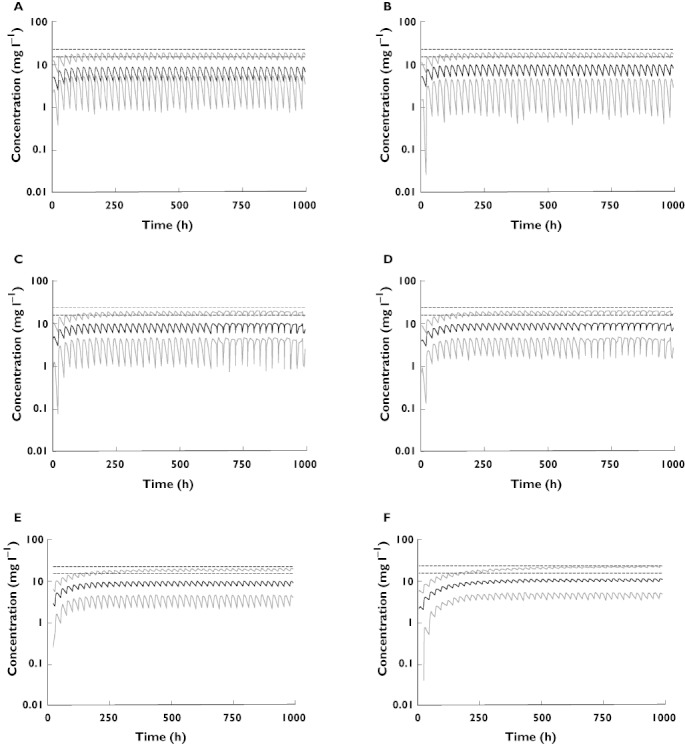
Figure 4.

The model predicted median (black lines) and 95% confidence intervals (grey lines) plasma concentrations of oxypurinol over time for patients being dosed with allopurinol according to the current dosing guidelines. Each panel depicts a patient with particular renal function receiving an allopurinol dose of (A) 350 mg day−1 (CLCr= 120 ml min−1), (B) 300 mg day−1 (CLCr= 100 ml min−1), (C) 250 mg day−1 (CLCr= 80 ml min−1), (D) 200 mg day−1 (CLCr= 60 ml min−1), (E) 150 mg day−1 (CLCr= 40 ml min−1) and (F) 100 mg day−1 (CLCr= 20 ml min−1) according to current allopurinol dosing guidelines [16]. The dashed line represents the minimum recommended target plasma oxypurinol concentration 15.2 −22.8 mg l−1
