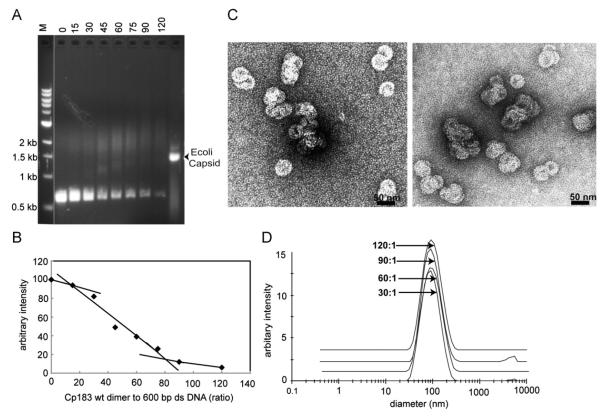
Fig. 3. Binding of 600 bp dsDNA by Cp183 dimer to dsDNA polymer.
(A) A representative EMSA of 600 bp dsDNA titrated with Cp183 dimer at the listed molar ratio. The molecular weight standard, lane M, is the same as in Fig. 1. All dsDNA gels used 1% agarose. (B) A plot of unbound 600 bp dsDNA from EMSA, quantified with imageJ (Abramoff et al., 2004), showing its disappearance as a function of protein concentration. In the absence of an analytical function to describe nucleic acid binding visualized by EMSA, straight lines were fit to subsets of data to highlight trends. (C) Negative stained micrographs of 600 bp dsDNA associated with core protein at ratios of 60:1 (left) and 120:1 (right); the scale bar is 50 nm. (D) Size distribution of Cp-DNA complexes, determined by DLS, increases as the Cp183:dsDNA ratio increases from 30:1 to 120:1; the respective centroids of diameters distributions are 83 nm, 78 nm, 91 nm and 89 nm.

