
Figure 7.
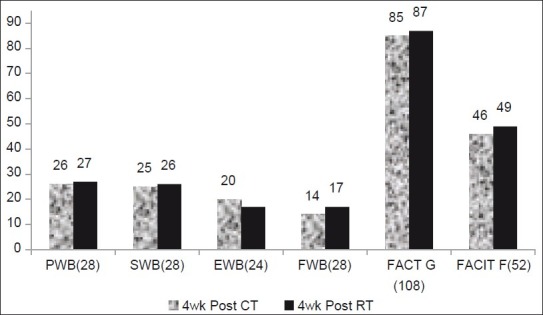
Changes in FACIT-F, FACT-G,PWB, SWB, EWB, and FWB during post-treatment week 4 assessments, showing the mean value of these three parameters
Official websites use .gov
A
.gov website belongs to an official
government organization in the United States.
Secure .gov websites use HTTPS
A lock (
) or https:// means you've safely
connected to the .gov website. Share sensitive
information only on official, secure websites.
Changes in FACIT-F, FACT-G,PWB, SWB, EWB, and FWB during post-treatment week 4 assessments, showing the mean value of these three parameters