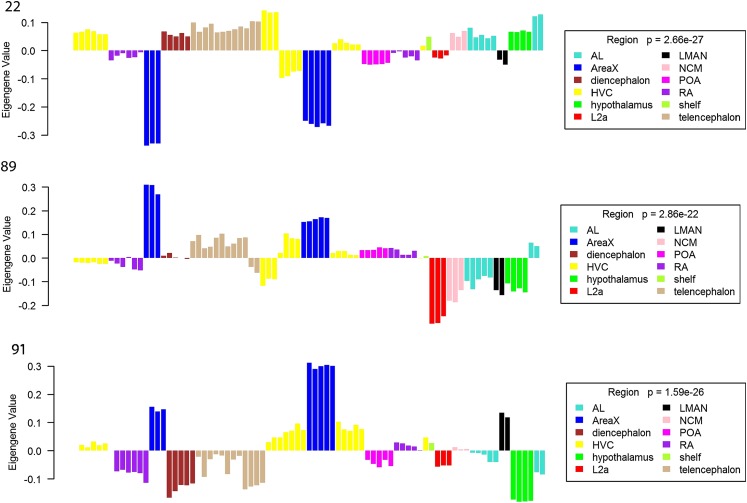
Fig. 2.
Plots of the representative expression patterns for modules 22 (Top), 89 (Middle), and 91 (Bottom), colored by brain region. Each bar represents one of the 80 treatment groups (treatment names are provided in SI Appendix, Fig. S6), and the height of the bar indicates the relative expression level for each group as estimated by the eigengene value. All three module types had significantly overrepresented GO terms and highly significant P values for brain region ANOVA. The expression patterns show that all three distinguish area X from the other regions. AL, auditory lobule; LMAN, lateral magnocellular nucleus of the anterior nidopallium; POA, preoptic area.

