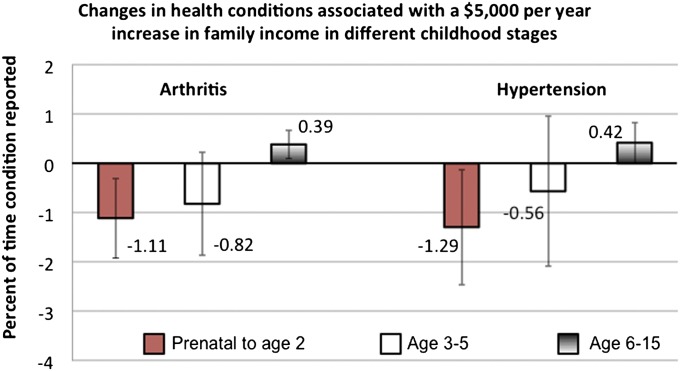
Fig. 3.
Simulated change in the percentage of times that health conditions were reported between age 30 and 41 y in response to a $5,000 (in 2010 dollars) annual increase in income status in various childhood stages. Red boxes show results for the prenatal year through age 2 y, white boxes show results for age 3–5 y, and gradient boxes show results for age 6–15 y. Information is based on regression results presented in Table S3. All results are based on estimates for individuals with childhood incomes below $25,000. All data come from the PSID and are weighted.

