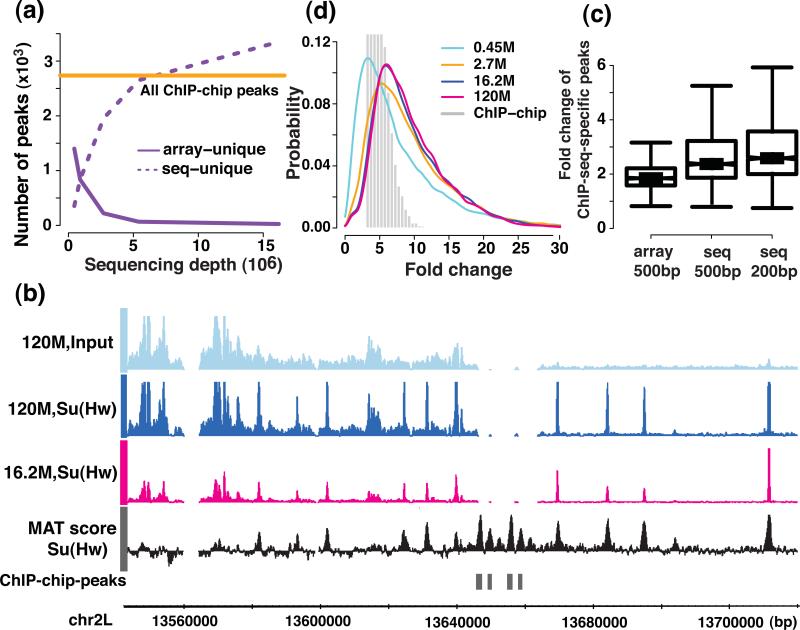
Figure 4. Comparison of the identified narrow peaks and the dynamic range between the sequencing and the tiling array platform.
(a) the number of identified peaks on different platforms and (b) examples of ChIP-chip peaks that were missed in the sequencing platform, the MAT score for ChIP-chip data, and the ChIP-seq signal coverage at the sequencing depths of 16.2 M and 120 M are shown. (c) The fold change difference between sequencing and tiling arrays in 200 bp and 500 bp windows centered on the peaks that were unique to the sequencing platform at a sequencing depth of 16.2 M (d) the dynamic range of the signal (ChIP versus the chromatin input fold change) are shown for the sequencing and the tiling array platform.

