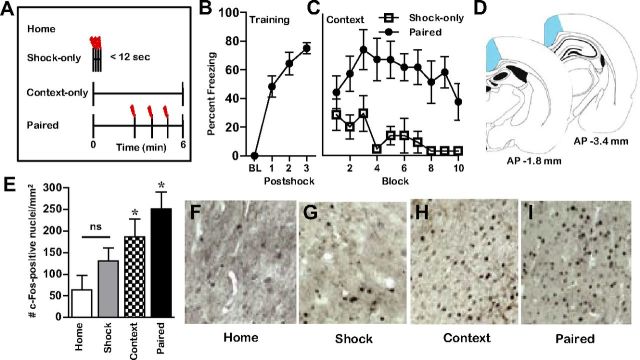
Figure 2.
Behavior and c-Fos protein expression in RSP following contextual fear conditioning. A, A schematic depicting the four behavioral conditions included in Experiment 1. Percentage freezing behavior displayed by rats during training (B) and context reexposure (C), confirming that rats in the shock-only condition did not form a context–shock association during acquisition. BL, Baseline. Shock-only (n = 8); Paired (n = 7). D, Brain diagrams representing the AP location of RSP (shaded area) from which IEG counts were made. The numbers in D reflect the AP distance (in millimeters) from bregma. E, Average (mean ± SEM) c-Fos protein expression in RSP across behavioral conditions. Home, Home cage (n = 7); Shock, shock-only (n = 6); Context, context-only (n = 7); Paired (n = 6). F–I, Representative images of c-Fos expression in RSP across behavioral conditions. The asterisk (*) indicates significant (p < 0.05) differences from all other conditions; ns indicates no significant difference.

