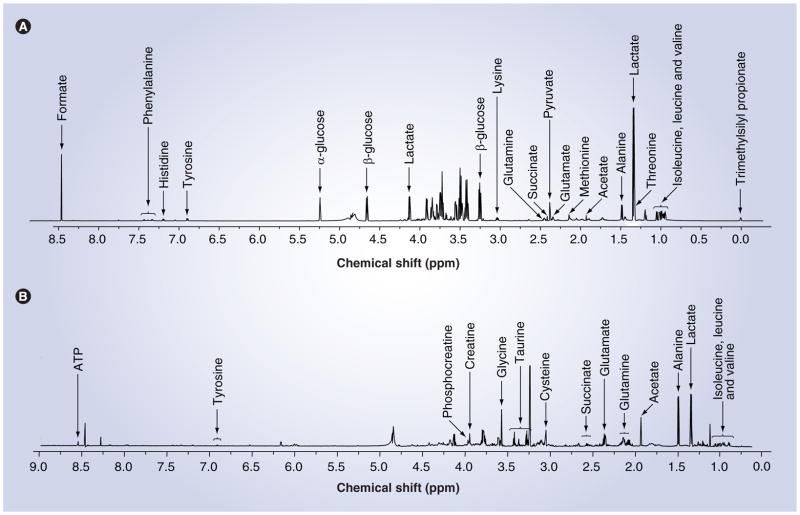
Figure 3. Metabolomic profiling using nuclear magnetic resonance spectroscopy.
Representative nuclear magnetic resonance spectra from (A) mouse induced pluripotent stem cells indicating extracellular metabolites identifiable within the cell culture media (metabolomic footprint) and (B) intracellular metabolites found within the cell (metabolomic fingerprint). Original nuclear magnetic resonance spectra were obtained on a Bruker Ultrashield 700 MHz spectrometer with a zgpr water suppression presaturation pulse.

