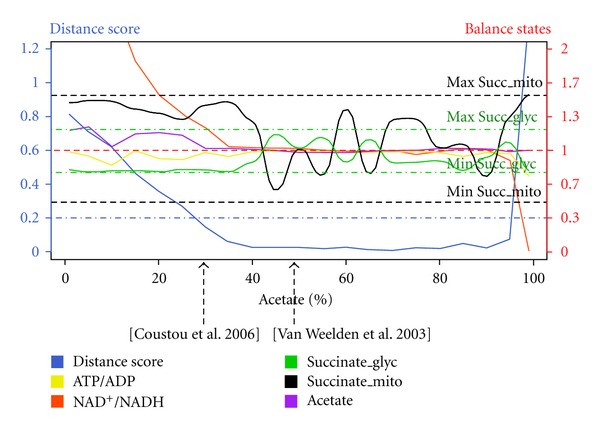
Figure 5.

Results for the distance score and balance constraint while varying the Acetate/Succinate proportions.These curves summarize several metabolite proportions as a function of the acetate/succinate proportion. For this experiment, the model was run with 3 constraints (1) The constraints over acetate/succinate proportions ranging from 1 to 99%, with 5% increment, (2) the proportion between the two succinate pools constrained to the ratio 56–86% for succinate_glyc against 14–44% for succinate_mito, and (3) ATP/ADP and NAD+/NADH balance being required to be equilibrated. The distance score (blue curve) is a function of the satisfaction of these constraints. When the distance score is less than 0.2, we consider that all the constraints are satisfied. We see that the constraints are satisfied for a proportion of acetate/succinate ranging between 26 and 95%. This corresponds to a predicted flux flexibility of 69%. In this area of flexibility are found the experimental results given by two publications. These experimental observations are indicated by two black dashed arrows.
