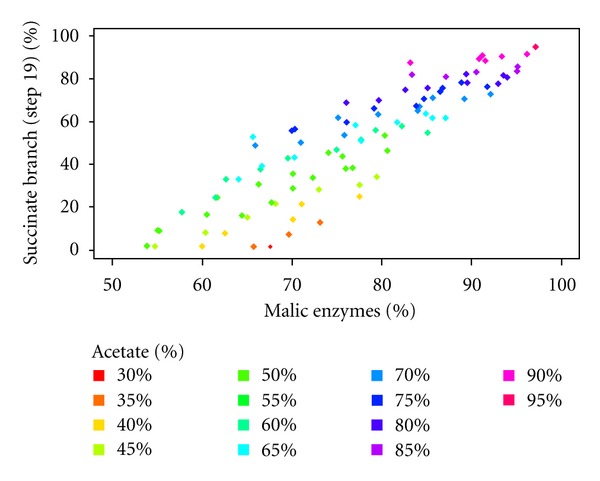
Figure 7.

Succinate branch/Malic enzyme. The biological constraints used for the previous analysis (Figure 5) have been also applied here. We represent the flux (%) between the succinate branch (step 19) and the ME. Only the distance points under the 0.2 limit are considered. The flux through the succinate branch increases linearly with the flux through the ME.
