
Fig. 5.
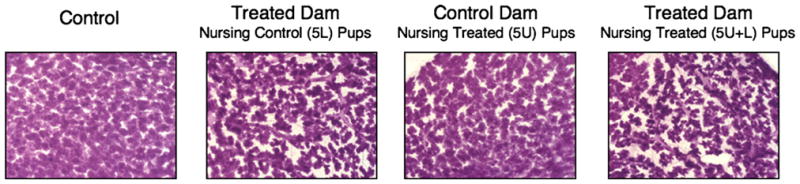
MG differentiation of lactating dams in the early-life effects cross-foster study. Whole mount preparations of mammary tissue from lactating dams are shown on PND 1, the first day of lactation (40×). Glands pictured are representative of lactating dams in respective groups at LD 1 (body weights given in Table 2; N = 4 dams per treatment group at each time point).