
Fig. 6.
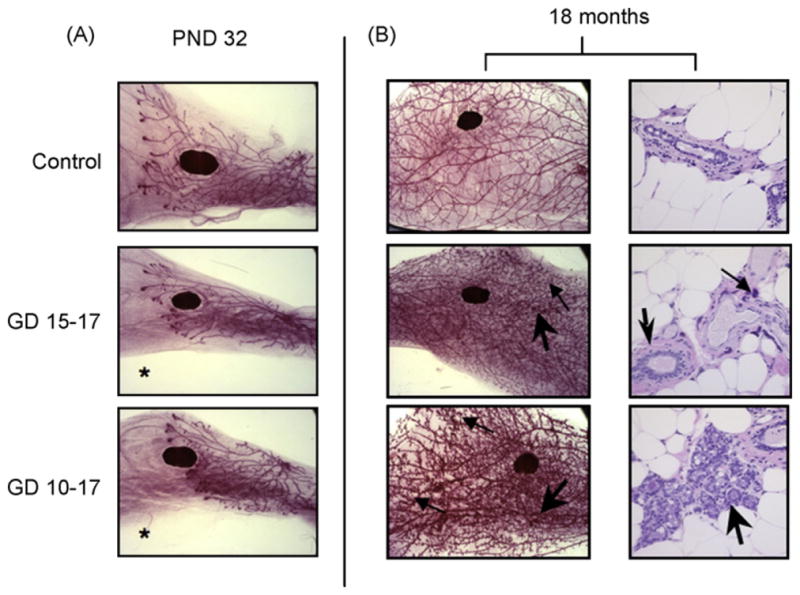
MG development of female offspring in the restricted-exposure study. (A) Whole mount preparations of mammary tissue are shown at PND 32 (16×). Glands pictured show morphology representative of respective treatment groups at given time points (Table 1; N = 10–20 females per treatment group at PND 32). *Significant treatment effect by ANOVA, compared to control; p < 0.05. (B) On the left, whole mount preparations of mammary tissue at 18 months of age are shown (16×). Large arrows identify unusual, darkly staining foci; small arrows identify peripheral, localized increases in epithelial density observed in some PFOA-exposed animals at 18 months. On the right, histopathologic images from contralateral glands in the same animal show ductal areas that might account for darkly staining foci observed on whole mounts (400×; N = 4–11 females per treatment group at 18 months). The large arrow in GD 15–17 identifies an area of increased stromal density; the small arrow points to a focus of inflammation. In GD 10–17 the arrow identifies a large, potentially hyperplastic region of ductal epithelium. These ductal pathologies were observed in all treatment groups; some ductal inflammation was also seen in controls.