
Figure 3.
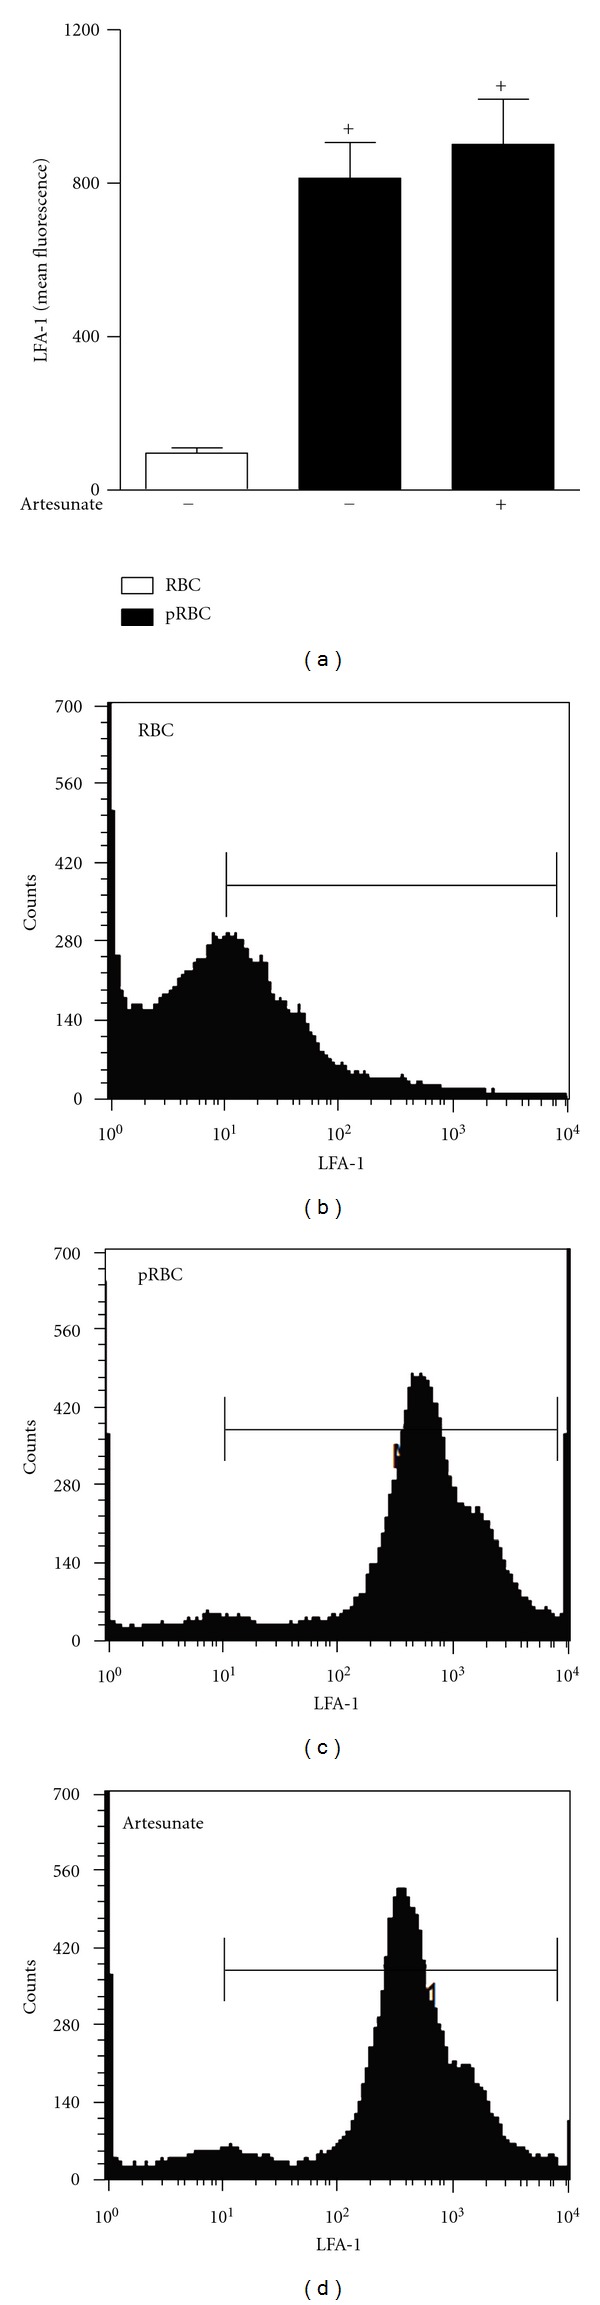
LFA-1 expression by splenocytes treated with artesunate and activated by pRBC. Representative histograms demonstrate the increase in fluorescence indicated by increase in LFA-1 expression in splenocytes. The results are expressed as the mean ± SEM from at least six animals per group from two different experiments. Statistically significant differences (P < 0.05) between the control and P. berghei-infected groups are indicated by +.