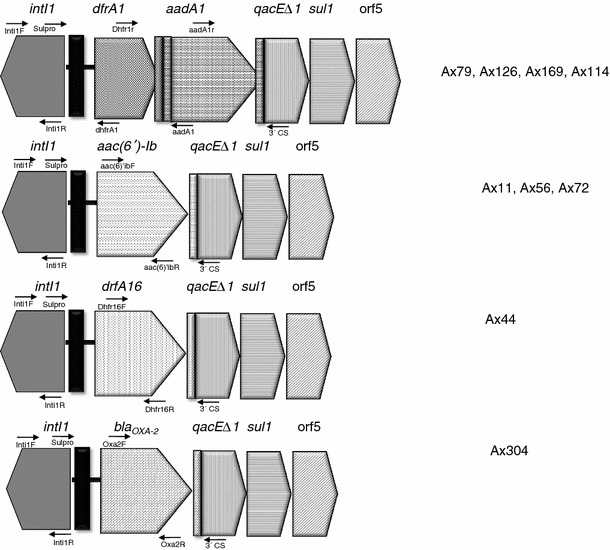
Fig. 1.

Schematic representation of arrays of class 1 integrons found among the A. xylosoxidans (n = 24) isolates. Thin black vertical closed bar The attI1 site, thin gray vertical closed bar the attC sites of the gene cassettes. Arrows The primers used to identify the class 1 integron vr. Figure is not in scale
