Figure 1.
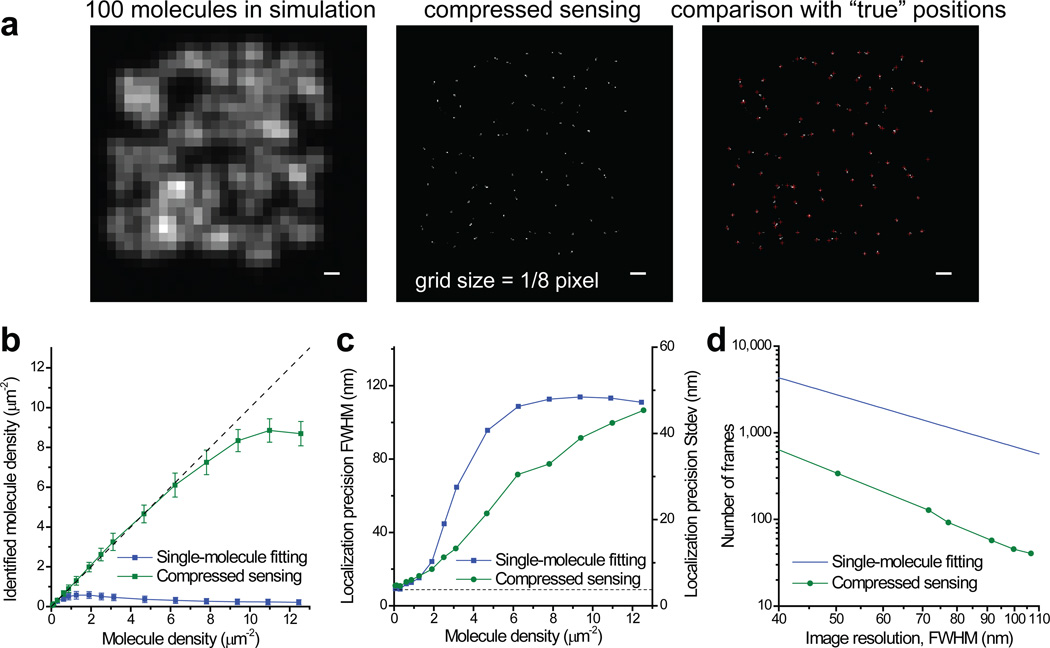
STORM image analysis using compressed sensing. (a) Simulations that demonstrate the capability of compressed sensing to identify molecules efficiently at a high density. Scale bars: 300 nm. Also see Supplementary Figure 7 for a low signal example. (b) Comparison of efficiency of molecule identification using compressed sensing and singe-molecule fitting. The simulation is for an average photon number of 3,000 per molecule and a background of 70 photons per pixel (see online Methods). Error bars stands for standard deviations from repeated simulations. The dashed line marks the case when the number of identified molecules equals to the number of molecule sin the simulation. (c) Comparison of localization precisions. The y axis is labeled in both FWHM and standard deviation (SD). The dashed line marks the Cremer-Rao lower bound (CRLB) of single-molecule localization (8.8 nm FWHM). (d) Minimum number of frames to achieve a given overall image resolution for a continuous 2D sample. The line for the fitting method is calculated using a constant 0.58 µm−2 identified molecule density, whereas the curves for the compressed sensing are calculated using identified molecule densities that allow the corresponding localization precisions to match the desired image resolution.

