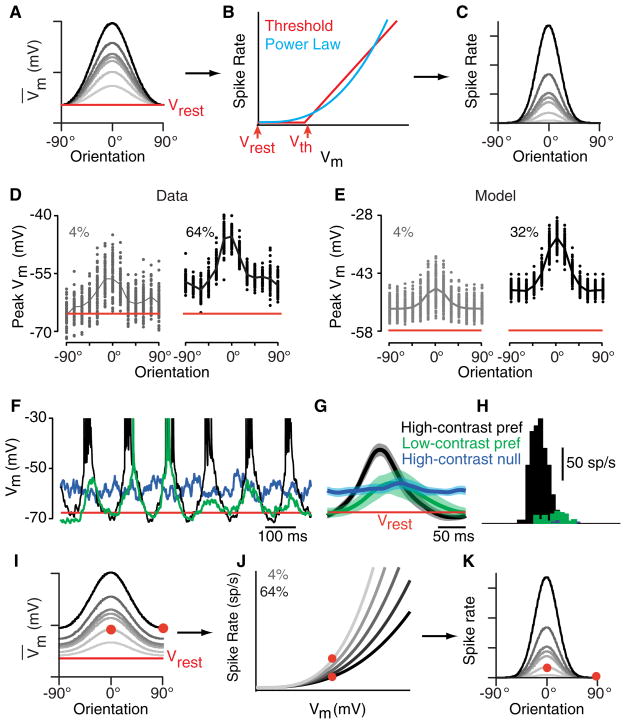
Figure 4. Trial-to-Trial Response Variability and the Origin of Contrast-Invariant Orientation Tuning in Simple Cells.
(A–C) A power-law relationship between Vm and spike rate (B) will transform a set of Gaussian orientation tuning curves for Vm with identical widths (A) into a set of Gaussian tuning curves for spike rate, again with identical, but narrower, widths (C). Tuning curves with no offset from rest, as in (A), are typical of cells dominated by cortical input.
(D) Amplitudes of individual Vm responses (points) and mean response amplitude (curve) for low and high contrasts recorded intracellularly from a simple cell.
(E) Same as (D) but derived from a feedforward model as described in the text.
(F) Intracellularly recorded Vm responses to six cycles of a grating at three different combinations of orientation and contrast.
(G) Average and trial-to-trial standard deviation (shading) for the three stimuli.
(H) Average spike responses for the three stimuli. (I–K) As in (A)–(C), for a simple cell dominated by input from the LGN. The Gaussian-shaped tuning curves for Vm therefore ride on a contrast-dependent offset (I). In order to achieve contrast-invariant orientation tuning of the spike rate responses (K), the relationship between Vm and spike rate must be contrast dependent (J), as determined by the contrast dependence of trial-to-trial variability (D).

