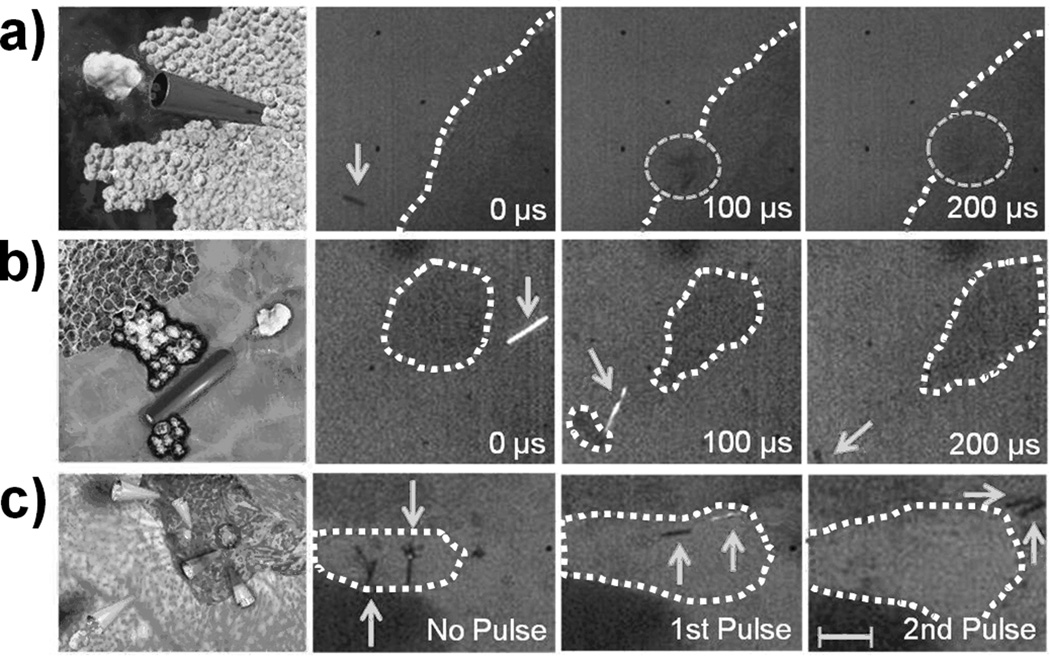
Figure 3.
Computer-aided graphic and corresponding experimental images of PFH-loaded MBs (a) penetrating, (b) cleaving, and (c) expanding a tissue following an US pulse signal, respectively. All images were taken sequentially at a frame rate of 10,000 fps and 10X objective. US pulses of 44 µsec/1.6 MPa were used for (a, b) and short 4.4 µsec/3.8 MPa were used for (c). Dotted circles and solid arrows are used to indicate the MB’s position, while curvilinear dotted lines outline the tissue. Scale bar = 100 µm in (a), 40 µm in (b), and 80 µm in (c).

