
Figure 3.
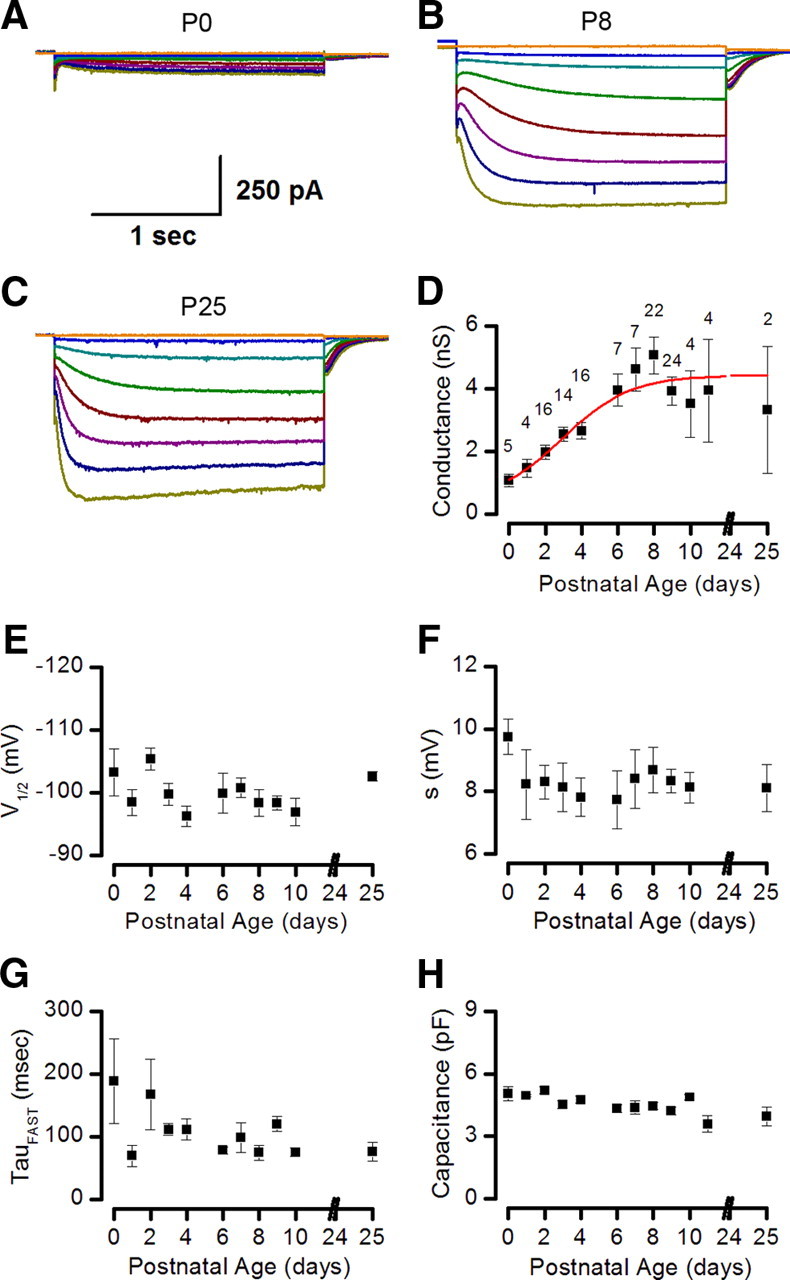
Age-dependent acquisition of Ih. A–C, Representative families of currents acquired from type II hair cells at P0 (A), P8 (B), and P25 (C). Note the increase in Ih between P0 and P8. Currents recorded at P25 resembled those found at P8. D, Plot of mean maximal conductance from type I and type II hair cells versus postnatal age. Conductance increased throughout the first postnatal week and reached a plateau beginning around P8. E–G, Half-activation potential (E), slope factor (s; F), and activation kinetics (G) from type II hair cells, plotted as a function of postnatal age. H, Whole-cell capacitance from both type I and type II hair cells plotted as a function of postnatal age. Number of samples at each developmental stage were as follows: P0, 5; P1, 4; P2, 16; P3, 14; P4, 16; P6, 7; P7, 7; P8, 22; P9, 24; P10, 4; P11, 4; and P25, 2.