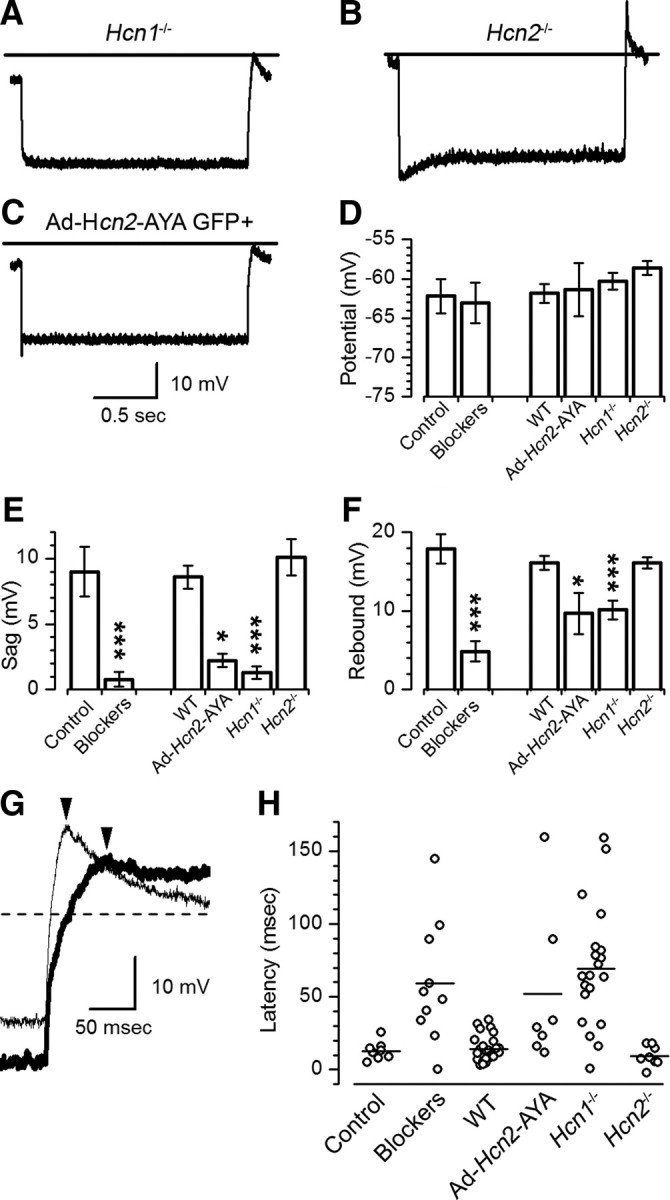
Figure 7.

Functional contributions of Ih. A, Representative voltage response from an Hcn1-deficient cell, demonstrating a loss of the sag and the rebound potentials. B, Voltage response of an Hcn2-deficient cell, demonstrating normal sag and rebound potentials. C, Voltage response from an HCN2-AYA transfected cell, demonstrating the loss of Ih. The scale bars in C apply to panels A–C; horizontal lines above traces indicate −60 mV. D–F, Mean values taken from current-clamp measurements of resting potential (D), sag potential (E), and rebound potential (F). Resting potential was measured from the first 50 data points at the beginning of the trace with current clamped at 0 pA. The sag potential was measured as the difference between the peak hyperpolarization and steady-state hyperpolarization near the end of the current step. The rebound was measured as the difference between resting potential and the peak depolarization at the end of the step. Mean values were measured as the average from eight control cells and the same eight cells following exposure to either 100 μm ZD7288 or 10 μm cilobradine, 25 wild-type cells, five cells exposed to the HCN2-AYA construct, 20 cells from Hcn1-deficient mice, and seven cells from Hcn2-deficient mice. Asterisks indicate statistically significant differences (*p < 0.05; ***p < 0.001) relative to WT. G, Magnified view of two representative rebound potentials. Trace from a wild-type cell (thin line) and an Hcn1 knock-out cell (thick line) are shown. Arrowheads mark the peak rebound potentials. H, Scatter plot showing latency measured as the temporal difference between the end of the step and the peak rebound potential. Solid lines represent means. The variability in control, wild-type, and Hcn2-deficient cells was minimal, while cells exposed to blockers, dominant-negative constructs, or cells deficient in Hcn1 showed considerable variation.
