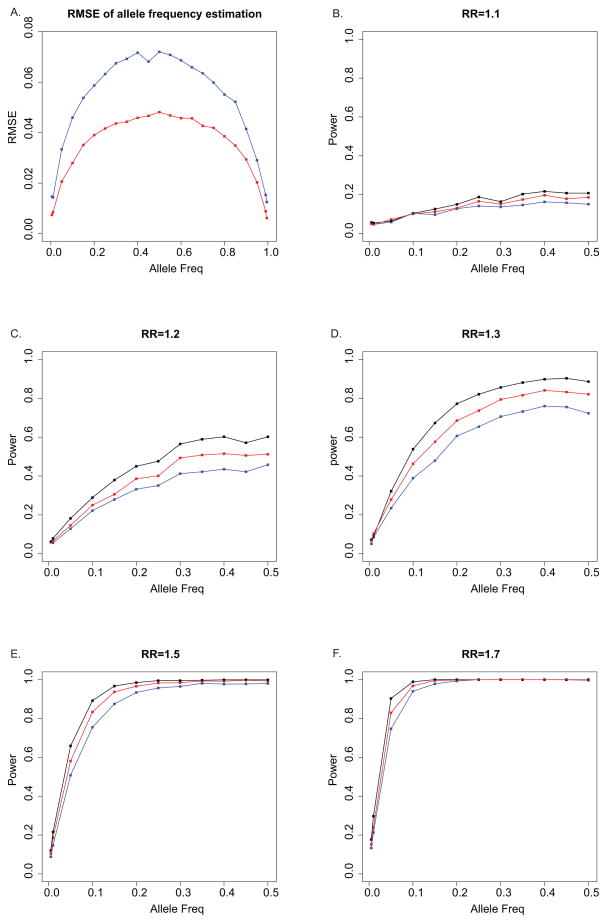
Figure 3.
Comparison of simulated data with simplified assumptions and simulated data with full model of errors and biases. A: Root mean square error (RMSE) of allele frequency estimation of pooled samples on population allele frequency ranging from 0.01 to 0.99; B – F: Power of disease association test of pooled samples on population allele frequency ranging from 0.01 to 0.5 with different relative risks (B: RR 1.1; C: RR 1.2; D: RR 1.3; E: RR 1.5; F: RR 1.7). Red lines represent simulated data with simplified assumptions; blue lines represent simulated full model with errors and biases added; black lines represent test results with assigned genotypes.

