
Fig 2.
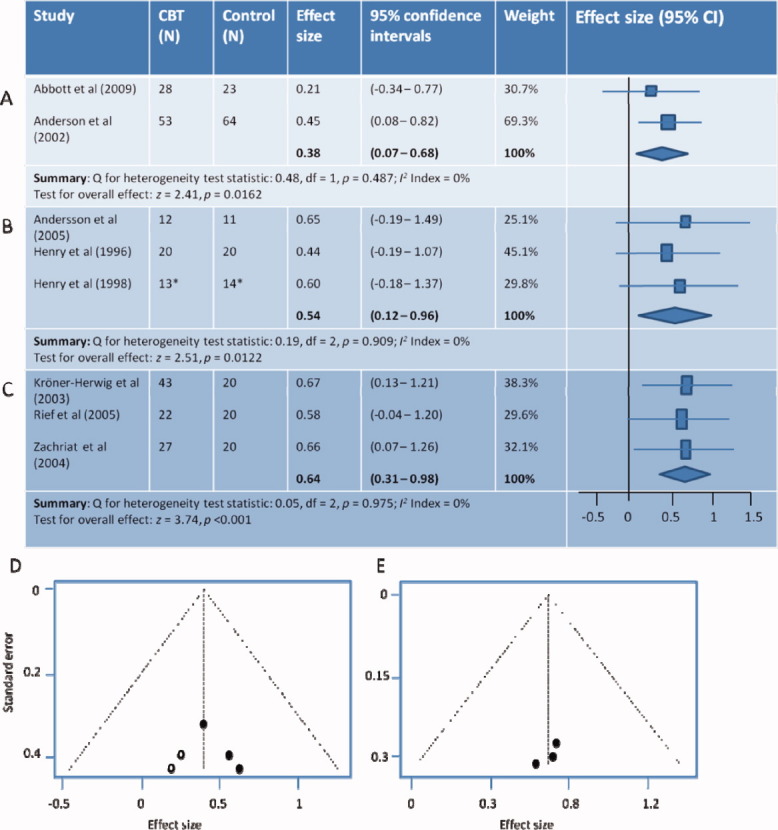
Meta-analyses of cognitive behavioral therapy (CBT) interventions. Pooled effect sizes and 95% confidence intervals (CI) are given in bold and as diamond shapes in the forest plot (right). (A) Comparison of internet-CBT versus control using Tinnitus Reaction Questionnaire (TRQ) total scores preintervention and postintervention. (B) Comparison of therapist-delivered CBT versus control TRQ total scores preintervention and postintervention. (C) Comparison of therapist-delivered CBT versus control Tinnitus Questionnaire (TQ) total scores preintervention and postintervention. (D) Funnel plot shows estimated effect against standard error (SE) for the therapist delivered CBT study using TRQ (filled circles). There is considerable asymmetry around mean effect size (evidence of publication bias). Open circles show calculated position of results from studies that would be required to bring the plot back to symmetry. (E) Funnel plot shows estimated effect against SE for the therapist delivered CBT studies using TQ. There is good symmetry and therefore no evidence of publication bias. *Sample sizes were assumed. [Color figure can be viewed in the online issue, which is available at wileyonlinelibrary.com.]