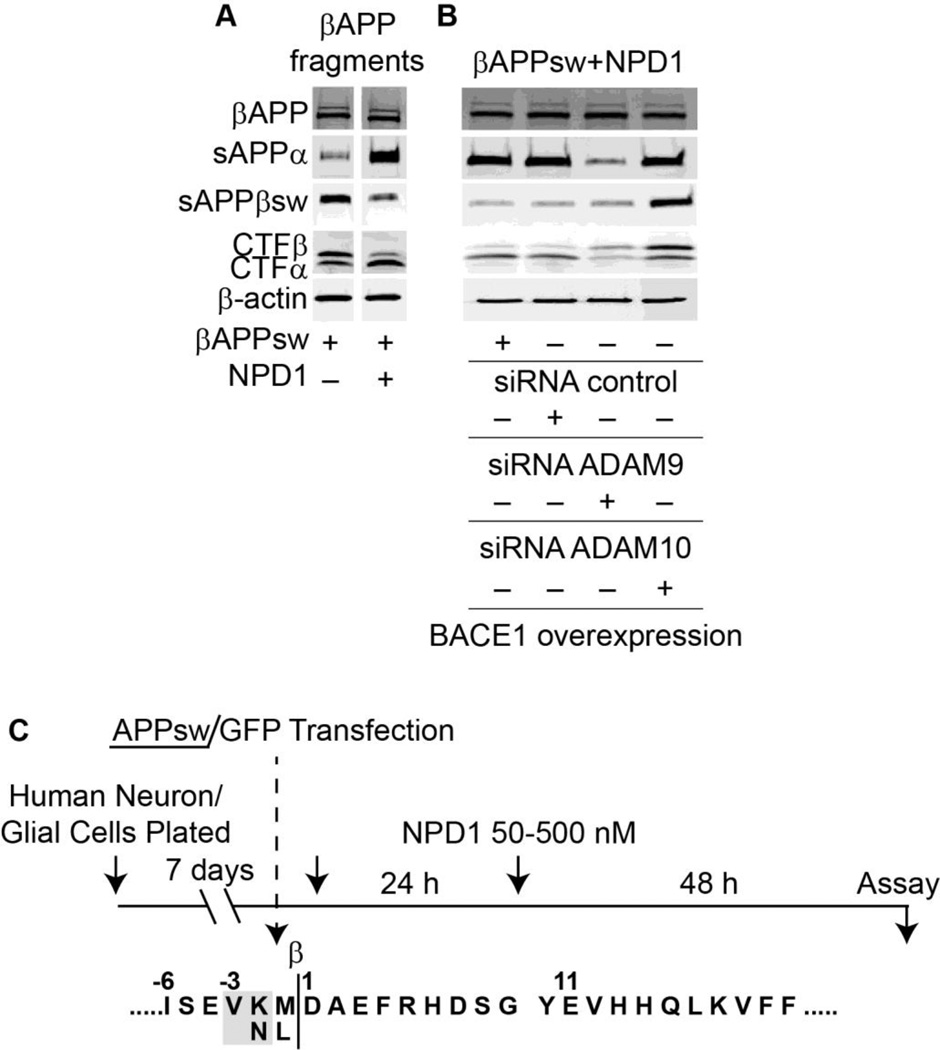
Figure 4. NPD1 shifts βAAP processing to a non-amyloidogenic pathway.
(A) Control or HNG cells over-expressing βAPPsw were treated with increasing concentrations (0, 50, 100, 500 nM) of NPD1 for 48 h and subjected to Western blot detection of holo-βAPP (βAPP holoenzyme), sAPPα, sAPPβsw, CTFα and CTFβ in comparison to β-actin levels in the same sample; (B) Quantification of gel bands in (A) analyzing βAPP fragments with increasing doses of NPD1. Results are means ± SEM (n=4); *p<0.01 vs. βAPPsw control.

