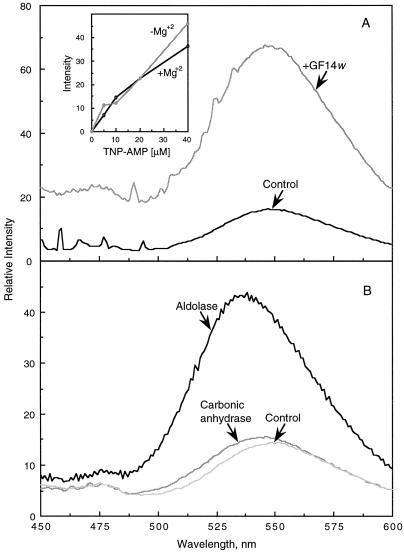
Figure 5.
The fluorescence emission spectra of TNP-AMP in the presence of GF14ω, aldolase, and carbonic anhydrase. A, Intrinsic fluorescence of 40 μm TNP-AMP in 100 mm Mops, pH 7.5, 10 mm Mg2+ (Control), followed by the addition of 150 μg of GF14ω. The inset shows the titration of 0 to 40 μm TNP-AMP in the presence or absence of 10 mm Mg2+. B, Intrinsic fluorescence of TNP-AMP in the absence of protein (Control), and two spectra after the addition of 150 μg of aldolase or carbonic anhydrase. For all assays, the excitation wavelength was 410 nm and the emission spectra was recorded from 450 to 600 nm, with maximal intensity at approximately 543 nm. Before recording the emission spectra a preincubation of 5 min at 22°C after the addition of TNP-AMP was allowed.

