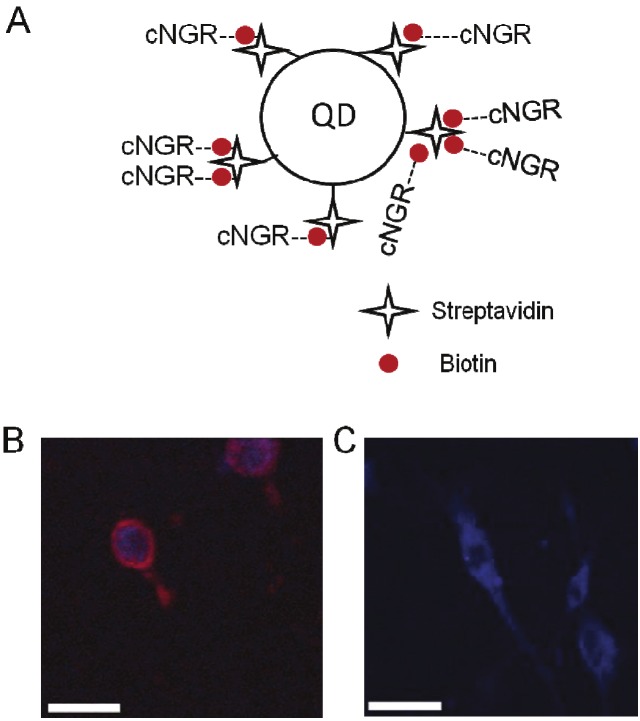
Figure 4.
In vitro imaging of cNGR-QD. (A) Structure of QD labeled by cNGR peptide. (B) (C) Fluorescent imaging of CD13-positive murine endothelial (2F-2B) cell line (B) and CD13-negative murine emangioendothelioma (EOMA) cell line (C) incubated with cNGR-QD for two hours. Red color is from QD; blue color is from the cell-nuclei stain with Syto44. Scale bar = 25 μm. Incubations of 2F2B cells with cNGR-OG488, cNGR only or with QD-streptavidin resulted in images similar to (C). Figures (B)(C) are adapted from reference [11].

