
Figure 2. Cam and ICa inactivation increase with increasing SR load.
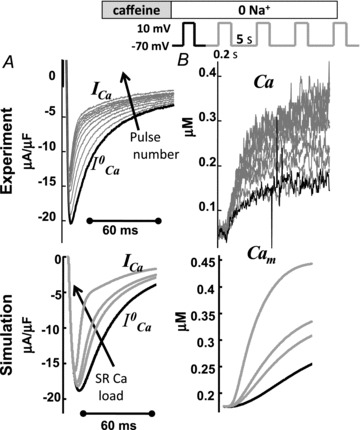
A, superimposed traces of ICa evoked by depolarizing pulses to 10 mV for 200 ms (inset on top show the experimental protocol). B, corresponding traces of the global Ca2+ transient (Cam). Experimental recordings are shown at the top, model simulations at the bottom. The first trace of ICa and of Cam after caffeine application (i.e. for depleted SR) is depicted in black. Arrows indicate increasing number of depolarizing pulses.