
Figure 4. An NCX partition of 25% in T-space and 75% in M-space provides the best fit to experimental data.
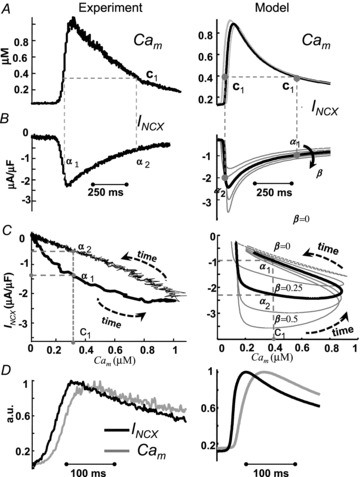
Peak Cam lags by 25 ms relative to peak INCX, reflecting the NCX partition. The fraction of NCX in T-space, β (right panels), estimated from best fit to experimental data (left panels). Experimentally recorded Cam (A, left) and INCX (B, left) evoked by caffeine pulse; V was held at −80 mV. Phase plots of INCX vs. Cai are constructed in C from the data in A and B. It is clear from panel C that INCX is a bi-valued function of Cam; that is, one value of Cam (e.g. c1) is associated with two values on INCX (α1 and α2). In panel C, right, β (fraction of NCX in T-space) is varied from 0 to 0.5. The continuous black trace is for 25% of INCX (β= 0.25) in the T-space, which provides the best fit for the experimental data. Note that for β= 0 (grey dashed trace), INCX is a single-valued function of Cam. D, INCX (black) and Cam (grey), corresponding to the traces in panels A and B, are shown on an expanded time scale. Cam, normalized to its peak value, is superimposed on normalized and inverted INCX. Note that peak INCX precedes peak Cam by about 25 ms in both simulation and experiment.