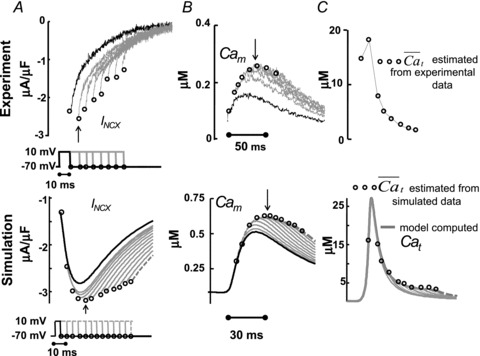
Figure 6. The time course of Cat, estimated from the INCX tail current.

Estimation of free Ca2+ in T-space, , using experimentally measured (top) and model generated (bottom) INCX and Cam, generated by V pulses as shown in the inset. A, INCX tail current traces. Raw current traces were truncated before the voltage was returned to the holding potential. Simulated traces, corresponding to the first and last V pulses, are shown in continuous and dashed black lines, respectively. B, corresponding optically measured (top) or model simulated (bottom) Cam. Circles in panels A and B indicate peaks of INCX tail currents and corresponding Cam values. Arrows in A and B indicate peak INCX and Cam, respectively. C, estimated Cat,
  , using eqn (12) with INCX from A and Cam from B as input. For the model-generated data (bottom panel), the actual model computed Cat is shown (grey traces) together with the estimated
  (circles).
