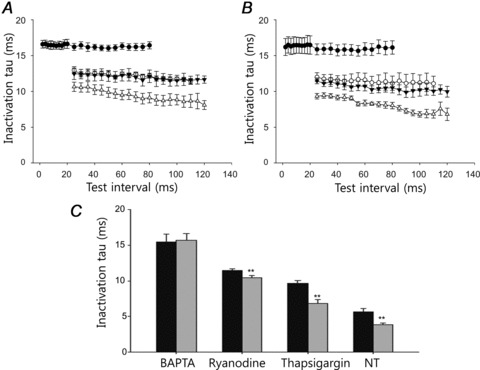
Figure 8. Influence of each factor on the inactivation time constant.

A, under physiological (NT) conditions, the changes in the inactivation time constant as a function of the time interval between the pre-pulse and test pulse in the presence of BAPTA (•), ryanodine (○), thapsigargin (▾) and none (▵). B, under Na+-free conditions, the changes in the inactivation time constant in the presence of BAPTA (•), ryanodine (○), thapsigargin (▾) and none (▵). C, the control inactivation time constants obtained by the single pulse applied at every 30 s. Black bars denotes NT conditions and grey bars show Na+-free conditions. Those were the paired experiments and ** denoted P value < 0.01.
