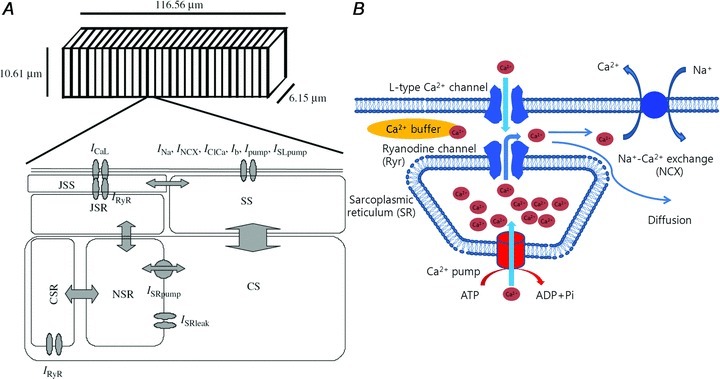
Figure 9. Model structure of cardiac myocytes in the pulmonary vein, showing components involved with the change of Ca2+ concentration in the junctional subsarcolemmal space (JSS).

A, the diagram shows half a sarcomere (adapted from Leem et al. 2006). B, sources of Ca2+ ingress and egress in the JSS.
