
Figure 4. ICaT current.
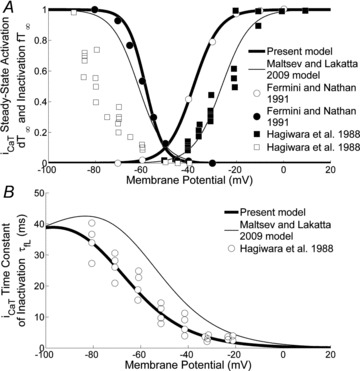
A, ICa,T activation and deactivation curves. Our activation and deactivation curves (thick lines), based on Fermini & Nathan's (1991) data (filled and open circles, respectively), are plotted along with the curves of the ML model (thin lines) and Hagiwara et al.'s (1988) data (filled and open squares, respectively). B, time constant of ICa,T inactivation. Compared are our curve (thick line), based on Hagiwara et al. (1988) (open circles) and the ML model curve (thin line).