
Figure 9. Action internal BAPTA.
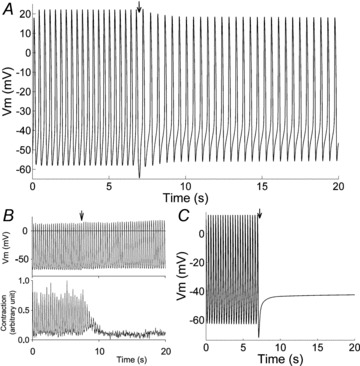
A, simulation of the effects of 10 mm BAPTA internal perfusion. B, spontaneous AP activity and cell contractions recorded experimentally upon perfusion with 10 mm BAPTA in guinea pig SAN cell (from Himeno et al. 2011, with permission of the American Physiological Society). C, same simulation in the ML model. Arrows in A and C indicate the beginning of the perfusion.