
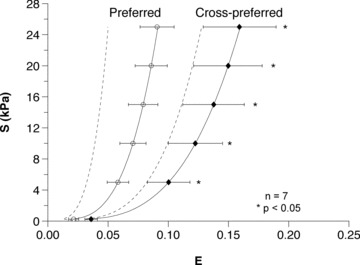
Figure 6. Representative (average) stress–strain equibiaxial stress responses for all seven specimens of the preferred and cross-preferred directions along with standard errors of the mean (*P < 0.05), demonstrating statistically significant differences between the preferred and cross-preferred mechanical responses.
To underscore the importance of our approach, we also show the stress–strain curves derived using the mean values (Table 1). While showing a qualitatively similar response, it also unsurprisingly demonstrated large differences from the actual mean responses and underscores the need for processing multi-axial mechanical data correctly.