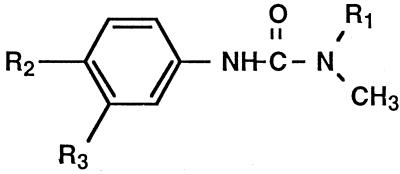
Table III.
Binding parameters of the spectra induced upon fixation of phenylureas in the active site of CYP76B1
The CYP76B1 concentration was 60 nm in the assays. Difference spectra were recorded after addition of increasing concentrations of ligands to the sample cuvette. An equal volume of the herbicide solvent DMSO was added to the reference. Ks and ΔAmax at saturating ligand concentrations were calculated from the double-reciprocal plots of ΔA(390–420nm) versus substrate concentrations.

