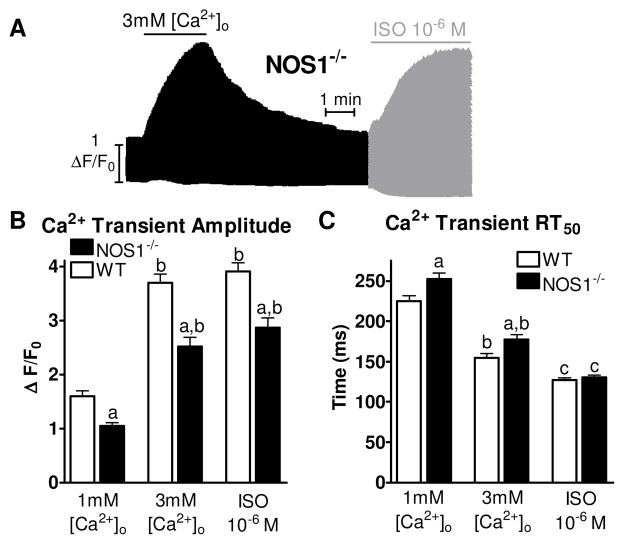
Figure 1.
Experimental Protocol. A) Representative time plot of the experimental protocol. B) Summary data (mean±sem) of maximum Ca2+ transient amplitude with 1 mM [Ca2+]o, 3mM [Ca2+]o, or ISO from WT (clear bar) and NOS1−/− (black bar) myocytes. C) Summary data (mean±sem) of Ca2+ transient decline measured as the RT50. a P<0.05 vs corresponding WT, b P<0.05 vs 1 mM [Ca2+]o, c P<0.05 vs 1mM and 3mM [Ca2+]o.

