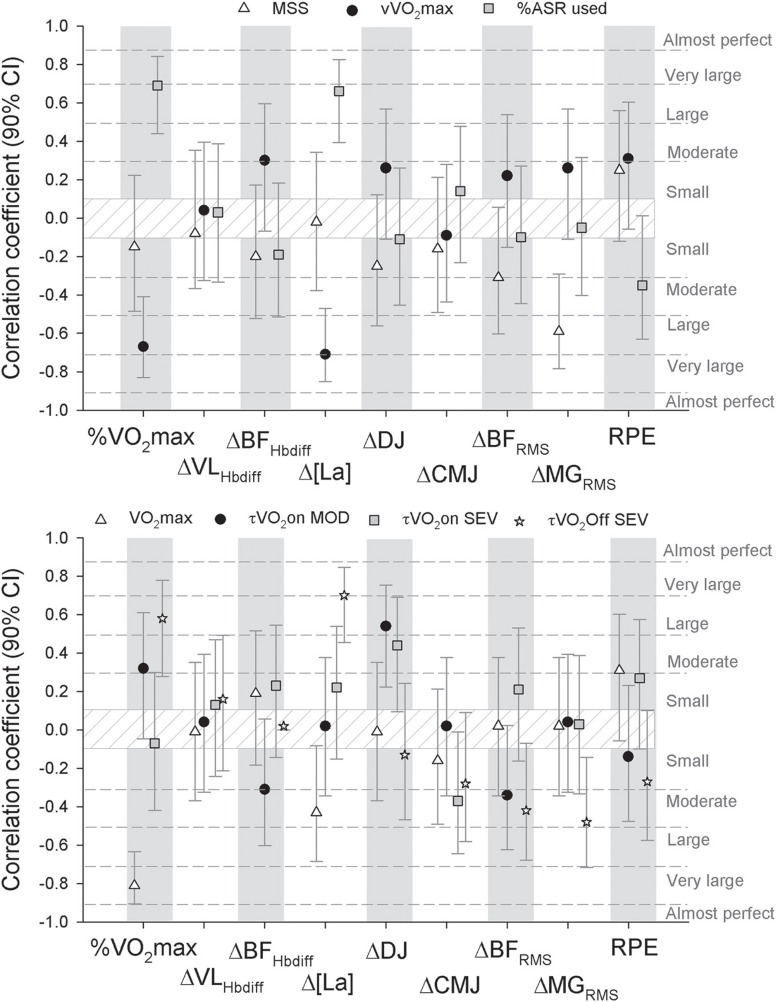
Figure 3.
Correlation coefficients (with confidence intervals) for the relationships between physiological, perceptual and neuromuscular responses to the two first sets of HIT [oxygen uptake expressed as a percentage of maximal oxygen uptake (%max), changes in vastus lateralis (ΔVLHbdiff) and biceps femoris (ΔBFHbdiff) oxygenation, changes in blood lactate (Δ[La]), changes in drop jump and counter movement jump height (ΔDJ and ΔCMJ), changes in muscle activity of the biceps femoris (ΔBFRMS), medial gastrocnemius (ΔMGRMS), and rate of perceived exertion (RPE)] and either locomotor profile [upper panel, maximal spring speed (MSS), the speed associated with maximal oxygen uptake (vmax), and the percentage of anaerobic reserve used (%ASR)] or measures of aerobic fitness and metabolic control [lower panel, maximal oxygen uptake (max), time constants of the primary component of the pulmonary kinetics at exercise onset in the moderate and severe exercise intensity domain, MOD and SEV, respectively and the time constants of the primary component of the pulmonary kinetics after exercise performed in the severe intensity domain, SEV].

