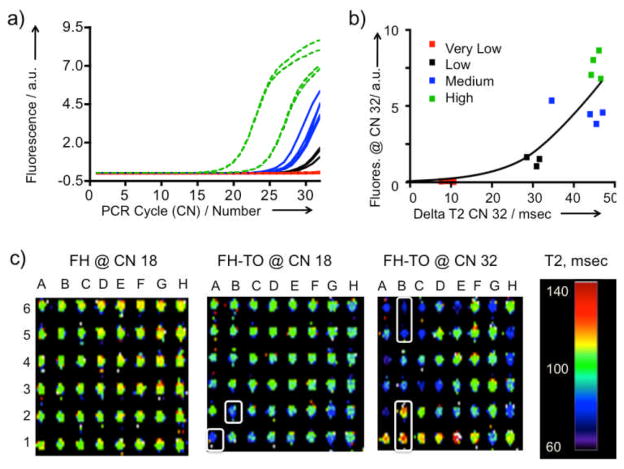
Figure 4.
Detection of apoptosis related gene expression by RT-PCR using FH-TO and MR. a) The RT-PCR reaction was monitored by fluorescence. Gene expression was classified as high (green), medium (blue), low (black) or very low (red). Reaction was stopped at 32 cycles to maximize the differences in fluorescence. The fluorescence response for all genes and over the entire cycle range is shown as Figure S2). FH-TO or FH was then added at CN =32 and delta T2 values determined by relaxometry. b) Comparison of fluorescence from a) with delta T2 values by relaxometry. Data fit the hyperbolic equation y = 0.2551 0.07007x, r2 = 0.76. c) MRI of the apoptosis related gene expression with FH-TO (or FH control). At CN=18 and FH addition, all wells were between 100 and 140 msec. At CN= 18, FH-TO the A1 and B2 wells had lower T2’s (more bluish) indicating PCR DNA production. At CN=32 some FH-TO wells have lower (B5, B6) and have higher T2’s than the FH control, (B1,B2), see text. FH-TO, and not FH, reacts with products of the RT-PCR reaction in a cycle dependent fashion.

