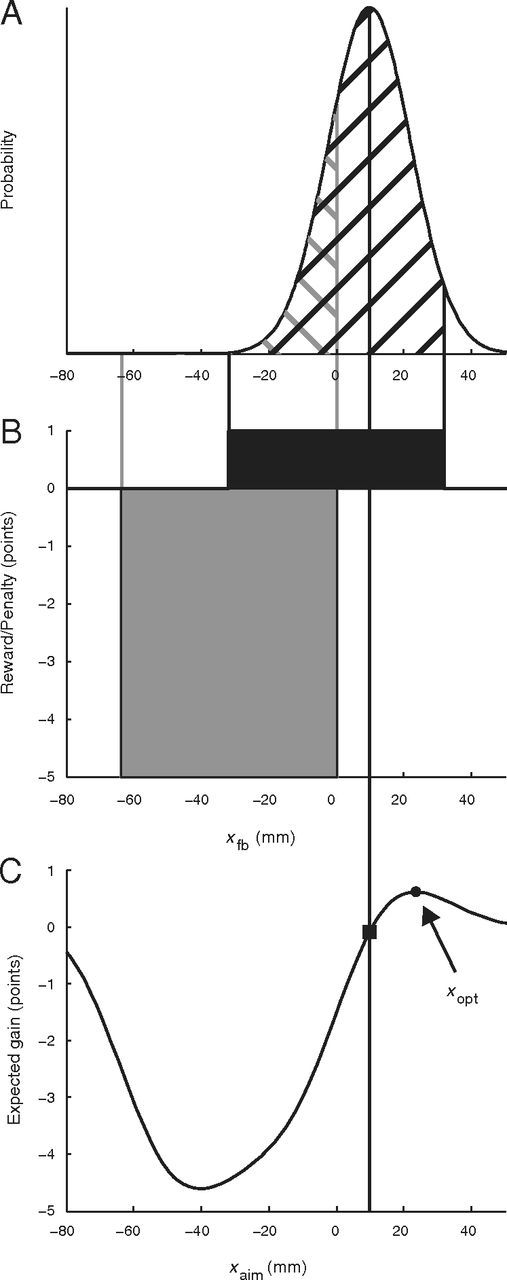
Figure 2.

Expected gain and optimal strategy. A, Illustration of the distribution of perturbed reach endpoints xfb for reaches with aim point xaim (indicated by the black vertical line). B, Experimenter-imposed rewards (black) and penalties (gray). The probability of hitting the target or penalty is indicated by the black and gray cross-hatching in A. C, Expected gain as a function of aim point. The black square indicates the expected gain for the example in A. The black circle corresponds to the optimal aim point xopt resulting in maximum expected gain.
