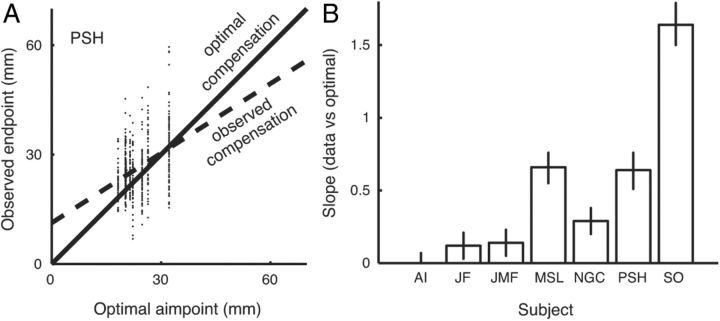
Figure 5.
Compensation for uncertainty. A, Scatterplot of reach endpoints as a function of the optimal aim point using the omniscient strategy. The solid identity line corresponds to the optimal omniscient strategy. The dashed regression line indicates the degree to which this participant responded to changes in outcome uncertainty. B, Regression slopes for all seven participants. Error bars are 95% confidence intervals. Six of seven participants had a significant degree of compensation for changing uncertainty. Most participants undercompensated, but one, S.O., overcompensated.

