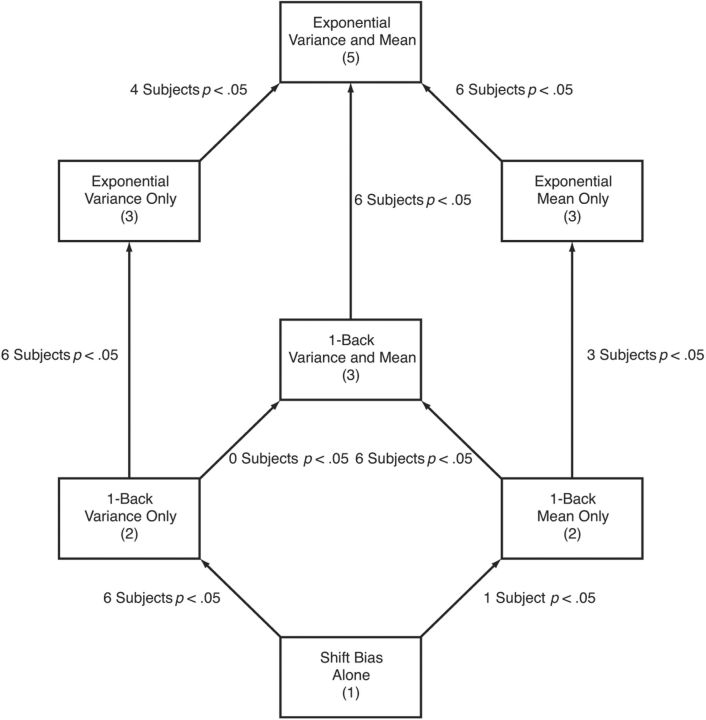
Figure 8.
Model comparison. The rectangles indicate each of the seven models fit to the data and the number of model parameters for each (excluding the noise parameter). The arrows indicate model nesting, with the more complex model placed higher in the figure. The labels on the arrows indicate the results of nested hypothesis tests done individually for each participant.

