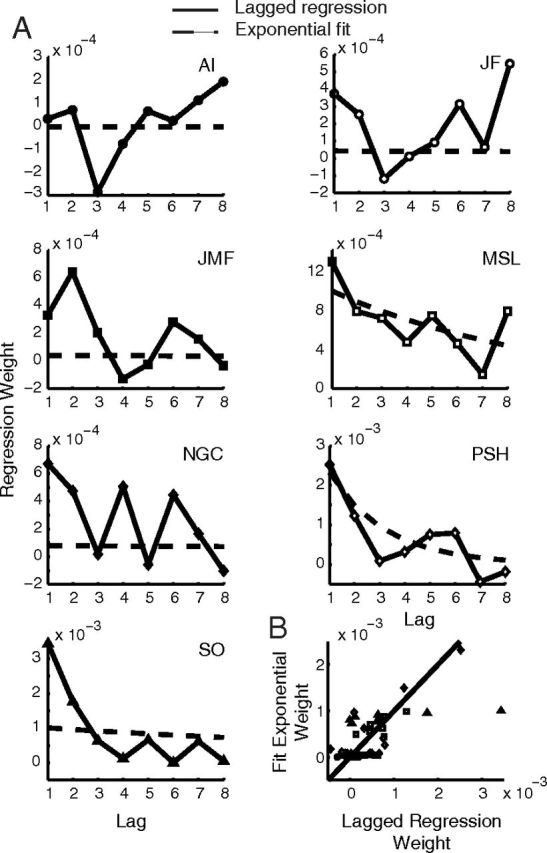
Figure 9.

Exponential model versus lagged regression. A, Lagged regressions (solid lines, from Fig. 7) and exponential weights (from fits of model 2, “Exponential variance only”) for each participant. Note the ordinate scale varies across subjects. B, Scatterplot of lagged regression versus exponential model weights.
