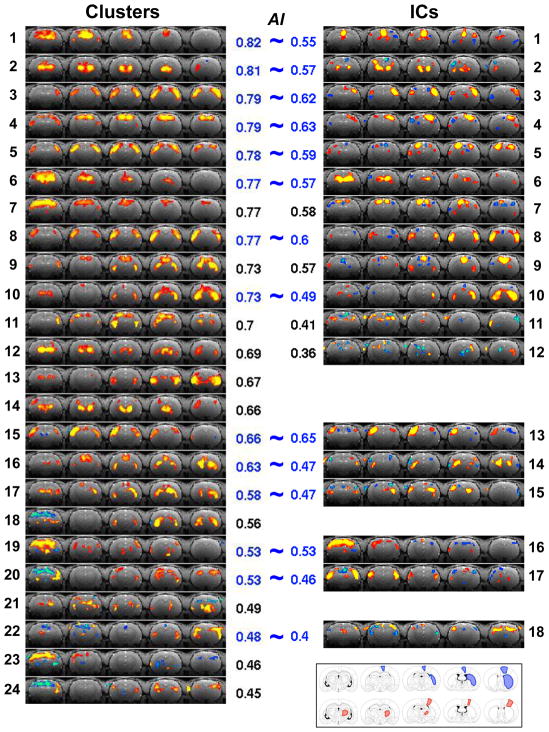
Figure 3.
Clusters and ICs for a single run of the representative rat (Run 1 of Rat 1). The clusters (left panel) are arranged from top to bottom according to their AI values, while the ICs (right panel) are displayed right next to their similar cluster if they have one, otherwise they are arranged according to their AI values. The AI values are shown next to the corresponding maps. The bottom-right corner shows the anatomical drawings indicating the motor–CPu (blue) and sensory–TN (red) networks (adapt from the reference of (Paxinos and Watson, 1998)).

