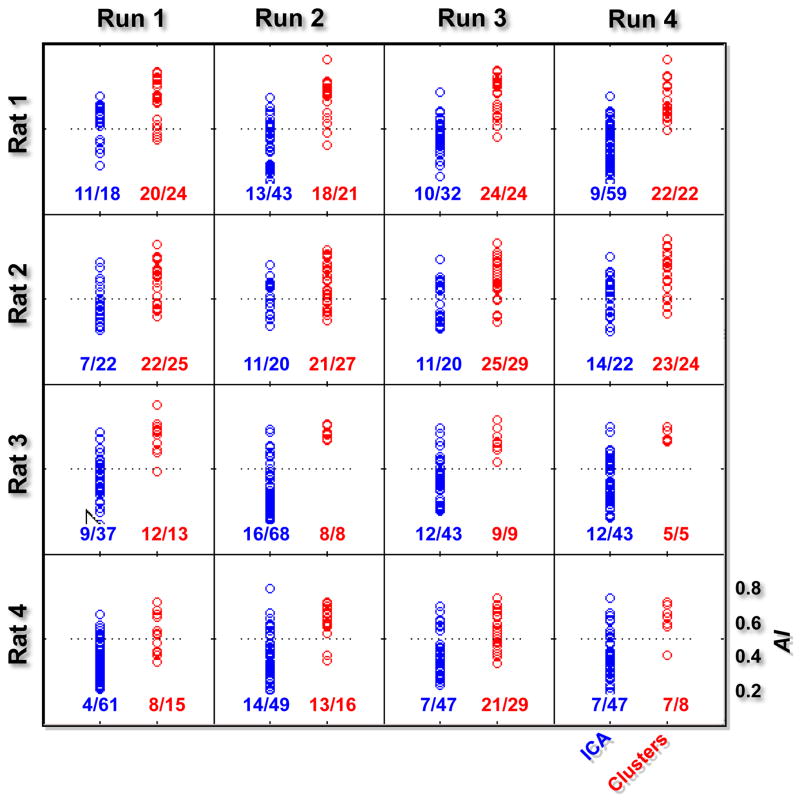
Figure 5.
AI values for clusters and ICs from all rats. Each plot represents the AI values for clusters (red points) and ICs (blue points) obtained from a single run, and numbers below give the fraction of clusters (ICs) having AI values higher than 0.5 (the horizontal dash line). The AI values of the clusters are significantly higher than those of ICs for all runs (p < 10−3).

